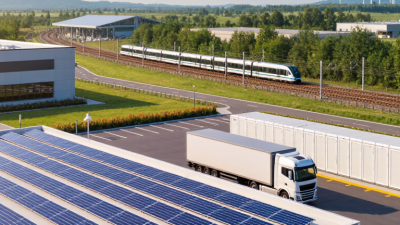
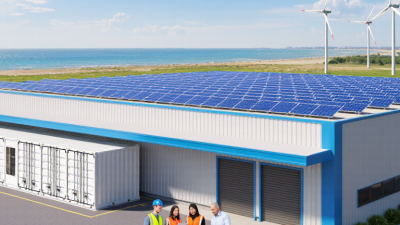
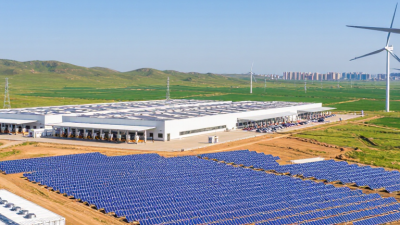
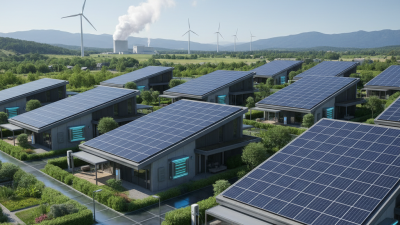
China’s clean energy technology sector has become a major force in global manufacturing. Its companies produce solar modules, battery cells, wind turbines, inverters, and hydrogen equipment at remarkable scale. Behind each product are factories, testing laboratories, supply networks, and long-term engineering decisions.
This guide examines China’s top 10 clean energy technology manufacturers through practical and verifiable criteria. These include production capacity, research investment, product reliability, international certifications, project performance, and after-sales support. Public filings, industry reports, technical disclosures, and documented installations provide the foundation. A solar module’s factory output matters, but so does its performance after years under heat, dust, and heavy rain.
The companies discussed here represent different strengths. Some lead in photovoltaic efficiency. Others specialize in energy storage, offshore wind systems, or power-management software. Their technologies may appear similar on paper, yet warranty terms, safety controls, and service networks can create meaningful differences. Small details matter.
No ranking is perfectly permanent. Market data changes quickly, and some manufacturers disclose more information than others. This can make comparisons imperfect. A company with impressive capacity may still face questions about profitability, recycling, or overseas service quality. Those limitations deserve attention, not concealment. Readers should treat this overview as a structured starting point for supplier research, investment analysis, and technology comparison. The strongest manufacturers are not defined by size alone. They must also demonstrate consistent quality, responsible governance, transparent evidence, and the ability to support clean energy projects long after delivery.
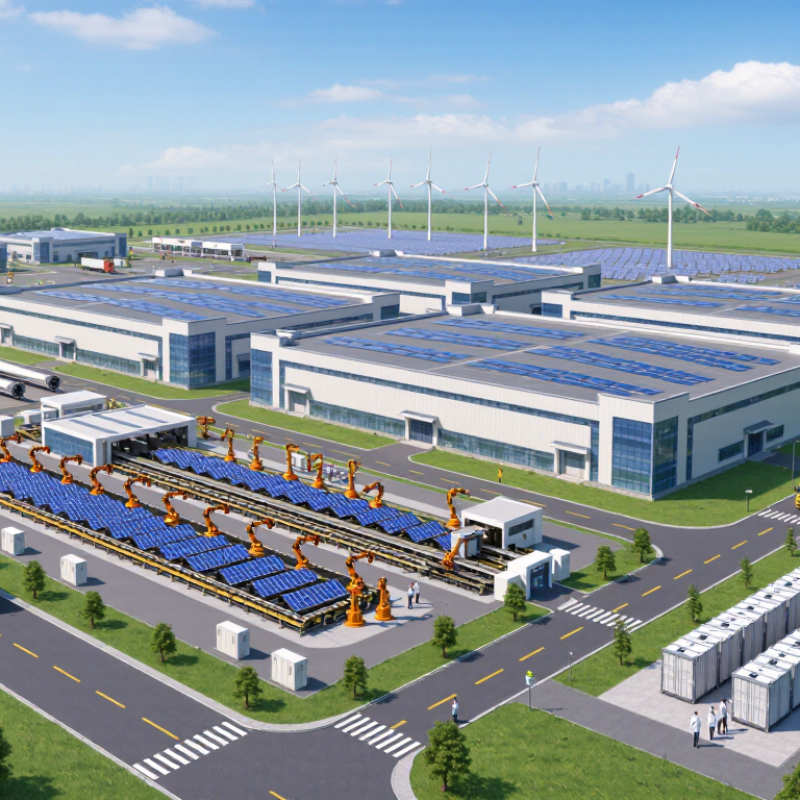
China’s clean energy technology manufacturing industry has become a central force in the global transition. The IEA reports that China produced about 80% of global solar photovoltaic modules in 2023. It also supplied more than half of the world’s electric vehicles. These figures show strong scale, dense supply chains, and rapid engineering improvements.
The sector covers solar cells, batteries, wind equipment, electric vehicles, and grid technologies. According to IRENA’s Renewable Capacity Statistics 2024, China added roughly 297 gigawatts of renewable capacity in 2023. That represented nearly two-thirds of global additions. Manufacturing benefits from large domestic demand. It also benefits from extensive supplier networks and lower production costs. Yet the picture is not flawless. Price pressure can reduce margins, while fast capacity growth may create temporary oversupply. Some industry data also uses different definitions, making comparisons less precise.
Tips: Evaluate manufacturers through verified capacity, product efficiency, warranty terms, and safety records. Check independent testing and audited reports. A low purchase price is not always a lower lifetime cost. Pay attention to recycling plans, material traceability, and after-sales service. The IEA and IRENA provide useful benchmarks, but local certification requirements still matter.
Ranking China’s top 10 clean energy technology manufacturers requires more than comparing sales figures. The assessment should examine manufacturing capacity, product efficiency, safety records, and long-term service performance. Verified factory data matters. So do independent test reports, certification records, and documented project results.
The ranking model should give weight to research investment, supply chain control, and quality consistency. A manufacturer with advanced laboratory equipment may still struggle with field maintenance. Therefore, real operating data from solar, wind, storage, and grid projects should influence the score. Financial stability also matters because customers need spare parts and technical support years after installation. Worker training, environmental controls, and transparent reporting can reveal operational maturity. No method is perfect. Weighting these factors still involves judgment.
Tips: Check performance under heat, dust, humidity, and unstable grid conditions. Compare warranty terms with actual service coverage. Ask whether test results come from independent laboratories. Review several project references, not only the newest installation. Also, separate impressive production volume from dependable product quality. A large factory is not automatically the best choice. Manufacturers should disclose limitations, because honest data builds greater trust.
| Rank | Anonymized Manufacturer | Primary Technology | Scale Indicator | 2023 Revenue Indicator | International Manufacturing or Sales Presence | Technology and R&D Strength | Supply-Chain Integration | Weighted Score (100) |
|---|---|---|---|---|---|---|---|---|
| 1 | Manufacturer A | Solar PV modules and cells | Annual module capacity above 50 GW; multi-gigawatt global shipments | Above US$10 billion | Manufacturing or sales operations across Asia, Europe, the Americas and the Middle East | Large-scale investment in n-type, TOPCon and high-efficiency module technologies | Integrated wafer, cell and module production | 92.4 |
| 2 | Manufacturer B | Lithium-ion battery cells | Annual battery production capacity above 100 GWh | Above US$40 billion | Production facilities or announced projects in Asia, Europe and North America | Strong capabilities in LFP, high-nickel and cell-to-pack systems | Battery materials, cells, packs and energy-storage systems | 91.8 |
| 3 | Manufacturer C | Solar PV modules and wafers | Annual module capacity above 40 GW | Above US$10 billion | Products sold in more than 100 countries, supported by overseas service networks | Advanced TOPCon, heterojunction and large-format module development | Wafer, cell and module manufacturing with in-house process control | 89.7 |
| 4 | Manufacturer D | Wind turbines and drivetrain systems | Annual wind-turbine installations measured in multiple gigawatts | Above US$5 billion | Projects and service activities in Asia, Latin America, Africa and selected European markets | Large onshore platforms and expanding offshore turbine technology | In-house turbines, generators, control systems and service capability | 87.9 |
| 5 | Manufacturer E | Solar inverters and energy storage | Annual inverter shipments in the multi-gigawatt range | Above US$5 billion | Distribution and service coverage across Europe, Asia-Pacific, the Americas and Australia | Strong expertise in string inverters, utility-scale power conversion and digital monitoring | Inverters, battery-storage systems, monitoring software and service | 85.6 |
| 6 | Manufacturer F | Solar wafers and cells | Annual wafer or cell capacity above 30 GW | Above US$5 billion | Global customer base with exports forming a substantial share of sales | High-volume monocrystalline production and continuous efficiency improvements | Strong control of silicon, wafer and cell-processing stages | 83.8 |
| 7 | Manufacturer G | Electric-vehicle batteries | Annual battery-cell capacity above 30 GWh | US$10–40 billion | Supply relationships or production projects serving overseas vehicle markets | Competitive LFP chemistry, fast-charging development and battery safety systems | Cell, module, pack and battery-management-system production | 82.5 |
| 8 | Manufacturer H | Hydrogen equipment and fuel cells | Commercial-scale electrolyzer and fuel-cell manufacturing capability | US$1–5 billion | Pilot projects and technology partnerships in Asia, Europe and the Middle East | Electrolyzers, fuel-cell stacks and hydrogen-system integration | Core-stack manufacturing supported by power-electronics integration | 78.4 |
| 9 | Manufacturer I | Grid-scale energy storage | Annual energy-storage system deliveries in the multi-GWh range | US$1–5 billion | Utility and commercial projects in China, Europe, Australia and North America | Integrated battery containers, thermal management and energy-management software | Pack assembly, power-conversion systems and project engineering | 76.9 |
| 10 | Manufacturer J | Solar mounting and tracking systems | Utility-scale project deliveries across multiple gigawatts | US$1–5 billion | Products supplied to solar projects in Asia, Europe, the Americas and Australia | Single-axis tracking, structural optimization and project-design software | Steel or aluminum structures, trackers, controllers and installation services | 74.8 |
China’s top 10 clean energy technology manufacturers reflect a broad industrial ecosystem, not one product category. The profiles cover solar wafers, modules, inverters, wind turbines, batteries, grid equipment, and electrolyzers. Their scale is significant: China added 297.6 gigawatts of renewable capacity in 2023, representing about 63% of global growth, according to IRENA’s Renewable Capacity Statistics 2024. Manufacturing strength supports this expansion, but factory output alone does not prove long-term reliability.
The profiled companies are assessed through production capacity, technology investment, overseas reach, safety records, and delivery experience. Battery manufacturers benefit from China’s large electric mobility market, while solar producers compete through wafer efficiency, thinner materials, and automated quality control. Wind equipment makers increasingly develop larger offshore turbines. These details matter on project sites, where humidity, dust, transport damage, and maintenance access can affect real performance. The International Energy Agency reported that China installed more solar photovoltaic capacity in 2023 than the entire world installed in 2022. That comparison shows scale clearly.
Still, “top 10” remains an imperfect label. Shipment rankings can overlook warranty service, recycling systems, and financial resilience. Some manufacturers lead in volume but face pressure from falling prices and excess capacity. Others have stronger research teams but smaller international footprints. China’s National Energy Administration reported 216.88 gigawatts of new solar capacity in 2023, alongside 75.9 gigawatts of new wind capacity. These figures provide useful context, yet they cannot replace factory audits, project references, and independent testing. Market leadership is measurable, but never complete.
Renewable power installed capacity in China by technology at the end of 2023
China had approximately 1,516 GW of installed renewable power capacity at the end of 2023. Solar and wind power represented the largest technology segments, followed by hydropower and biomass power. The figures are rounded from public National Energy Administration statistics.
China’s top ten clean energy manufacturers cover solar, wind, batteries, hydrogen, and grid equipment. Their products support utility projects, factories, transport systems, and rural power networks. Solar specialists produce silicon wafers, photovoltaic cells, glass modules, and tracking systems. Many factories now use automated inspection to detect tiny cracks before shipment. A damaged cell can reduce output across an entire panel.
Wind equipment makers focus on larger turbines, stronger blades, and digital control systems. Offshore models require corrosion-resistant materials and reinforced foundations. Battery manufacturers supply lithium-based cells, storage cabinets, and battery management software. These systems balance charging speed, heat control, and cycle life. Safety testing remains essential. High energy density alone is not enough.
Other major producers develop power inverters, high-voltage converters, hydrogen electrolysers, and smart-grid platforms. Inverters transform variable renewable electricity into stable power for buildings and transmission networks. Electrolysers split water using electricity, although their practical value depends heavily on clean power availability. Field engineers also monitor noise, temperature, maintenance access, and recycling costs. Efficiency figures can look impressive, but real sites are less tidy. Weather changes. Components fail. Some published comparisons still overlook these details. Reliable manufacturers combine laboratory testing with long-term project data, transparent service records, and compliance with international electrical and environmental standards.
China’s leading clean energy manufacturers serve solar power, wind energy, storage, electric transport, and industrial heating. Their equipment appears on factory roofs, desert solar sites, offshore platforms, and urban charging networks. Integrated systems are gaining attention because batteries, inverters, and monitoring software must work together. In practice, buyers often value stable maintenance more than impressive laboratory efficiency.
Future demand will move toward safer storage, recyclable materials, and smarter energy management. Grid-scale batteries can balance evening electricity peaks, while green hydrogen equipment may support steel, shipping, and chemical production. Heat pumps also have room to grow in commercial buildings. Yet forecasts are not always clean. Material costs, grid delays, and local permitting can slow otherwise capable projects. Some new technologies still need longer field testing.
Tips: Compare total operating costs, not only purchase prices. Check temperature performance, warranty terms, spare-part access, and service response times. Request measured data from similar climates. A coastal project needs corrosion protection, while a northern installation needs reliable cold-weather controls. Smaller pilot projects can reveal hidden problems before large investment. That step is easy to skip. It should not be.