China Top 10 Sustainable Energy Systems Manufacturers

China’s sustainable energy systems industry has moved from low-cost manufacturing toward integrated solutions for solar power, wind energy, battery storage, smart grids, and green hydrogen. This shift matters as electricity demand grows and energy security becomes more complex. The International Energy Agency’s Renewables 2024 report expects China to provide almost 60% of global renewable capacity additions through 2030. IRENA’s Renewable Capacity Statistics 2025 recorded China adding more than 370 gigawatts of renewable capacity in 2024. The scale is difficult to ignore.

Still, scale does not guarantee quality.

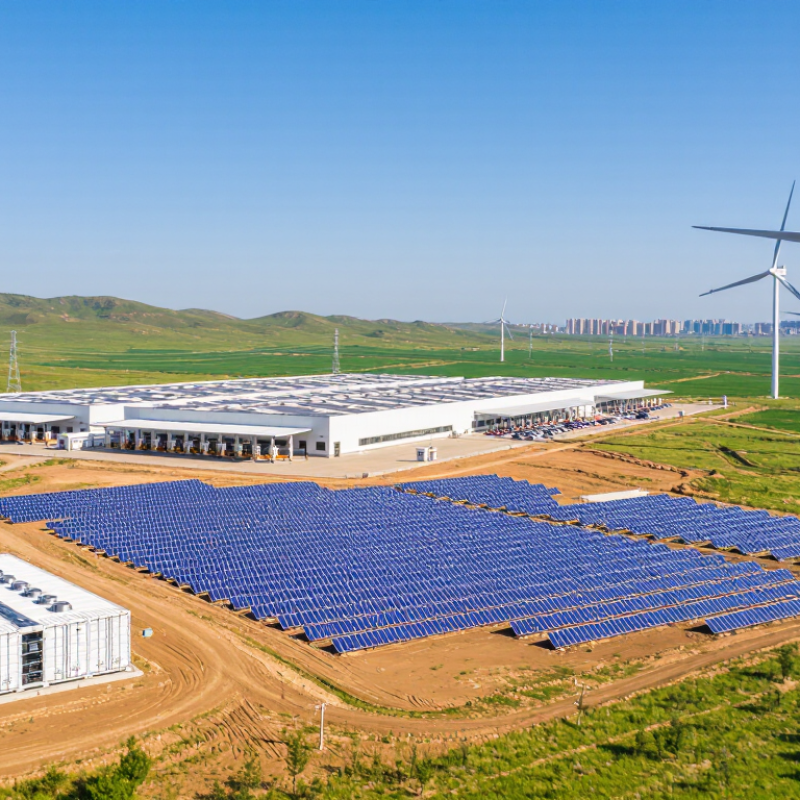
This guide examines China’s top 10 sustainable energy systems manufacturers through product capability, research investment, global deployment, supply-chain strength, and environmental transparency. The companies may include photovoltaic leaders, battery producers, wind-turbine manufacturers, inverter specialists, and integrated energy-service providers. Their equipment appears in utility-scale projects, factory rooftops, electric-vehicle charging networks, and remote microgrids. A battery container beside a solar farm can illustrate the practical change: power is stored at noon and released after sunset.

Fatih Birol, Executive Director of the IEA, said, “The clean energy transition is happening worldwide and it’s unstoppable.” That statement captures the direction, but not every outcome. Manufacturing emissions, mineral sourcing, recycling capacity, grid congestion, and overseas project risks still require scrutiny. Rankings also depend on incomplete disclosures and changing market conditions. Therefore, this introduction treats the list as a structured industry comparison, not a permanent verdict. Readers should verify certifications, warranty terms, lifecycle data, and local compliance before making commercial decisions.

China Top 10 Sustainable Energy Systems Manufacturers

Scope: What Makes a Sustainable Energy Systems Manufacturer in China?

China Top 10 Sustainable Energy Systems Manufacturers

Asustainable energy systems manufacturer must deliver more than solar panels, batteries, or control cabinets. It should measure carbon emissions, water use, energy consumption, and material recovery across the product life cycle. The IEA’s Renewables 2024 report expects China to provide almost 60% of global renewable capacity expansion through 2030. This scale increases responsibility for transparent manufacturing and reliable after-sales service.

Performance evidence matters. Manufacturers should publish tested efficiency, degradation rates, safety records, and grid-response data. The IRENA Renewable Capacity Statistics 2025 report shows China added about 373 gigawatts of renewable capacity in 2024. Such rapid deployment makes quality control essential, especially in harsh industrial sites and remote solar farms. A credible supplier also uses traceable materials, certified management systems, and documented recycling channels. Claims need testing.

Site experience reveals details that brochures often miss. Engineers should inspect thermal management, cable protection, software updates, spare-part access, and response times during equipment failures. A sustainable system should reduce diesel backup use, stabilize local power, and remain maintainable for many years. However, no factory is impact-free. Manufacturing still consumes minerals, electricity, and water. A fair evaluation should therefore examine verified data, independent audits, worker safety, and end-of-life planning instead of relying on production volume alone. Even a high-ranking manufacturer may need to improve.

China’s Renewable Capacity Reached 1.89 TW in 2024, Reports NEA

China Top 10 Sustainable Energy Systems Manufacturers

China’s renewable energy capacity reached 1.89 terawatts in 2024, according to the National Energy Administration. This figure includes hydropower, wind power, solar power, and biomass facilities. It reflects installed capacity, not constant electricity production. That distinction matters.

The scale is visible across the country. Solar panels cover industrial rooftops, while large wind turbines operate across northern grasslands. Coastal provinces are also expanding offshore wind projects and integrated storage systems. These developments support demand for advanced inverters, battery storage, grid controls, and energy management equipment.

A practical review of China’s top sustainable energy systems manufacturers should examine more than production volume. Strong candidates need verified operating records, reliable safety controls, and tested performance in different climates. Supply-chain transparency and after-sales service also deserve attention. Certification alone is not enough. Real project data is better.

The 1.89 TW milestone shows impressive momentum, but it also exposes difficult questions. Can transmission networks absorb more variable power? Will storage keep pace with solar growth? Some systems still face curtailment, maintenance, and recycling challenges. These weaknesses should remain part of any serious market assessment. Progress is substantial. It is not finished.

China Top 10 Sustainable Energy Systems Manufacturers - China’s Renewable Capacity Reached 1.89 TW in 2024, Reports NEA
No. Market Indicator 2024 Data Measurement Basis Official Data Context
1 Total Renewable Energy Capacity Approximately 1.89 TW Installed capacity at year-end National Energy Administration (NEA), 2024 renewable energy development data
2 Solar Power Capacity Approximately 887 GW Grid-connected solar photovoltaic and solar thermal capacity NEA, national power industry statistics for 2024
3 Wind Power Capacity Approximately 521 GW Grid-connected onshore and offshore wind capacity NEA, national power industry statistics for 2024
4 Hydropower Capacity Approximately 436 GW Conventional hydropower and pumped-storage capacity NEA, national power industry statistics for 2024
5 Biomass Power Capacity Approximately 46 GW Biomass, waste-to-energy, and biogas power capacity NEA, national power industry statistics for 2024
6 Combined Wind and Solar Capacity Approximately 1.41 TW Wind capacity plus solar capacity Calculated from NEA-reported 2024 wind and solar capacity figures
7 Renewables’ Share of Total Installed Power Capacity Approximately 56% Renewable capacity divided by total national power capacity NEA, 2024 national power capacity statistics
8 Annual Renewable Capacity Additions Approximately 370 GW New renewable power capacity commissioned during 2024 Aggregated from NEA-reported additions across major renewable technologies
9 Renewable Capacity Growth Approximately 25% year on year Comparison of year-end renewable capacity in 2024 and 2023 Calculated from NEA year-end renewable capacity statistics
10 Renewable Electricity Generation Approximately 3.46 trillion kWh Electricity generated from renewable energy sources during 2024 NEA, 2024 renewable energy utilization and electricity generation data

Note: Figures are rounded for presentation. The table summarizes China’s national renewable-energy system market using publicly reported 2024 data and does not present company-level or brand-level information.

Ranking Criteria: Technology, Capacity, ESG, Exports, and Reliability

China Top 10 Sustainable Energy Systems Manufacturers

Our ranking measures more than factory size. Technology receives 25% of the score, including conversion efficiency, storage integration, grid compatibility, and documented product improvement. Capacity receives 20%, based on audited production, installed systems, and delivery consistency. IRENA’s Renewable Capacity Statistics 2024 recorded 473 GW of renewable capacity added globally in 2023. That growth increases pressure on manufacturers to scale without weakening quality.

ESG represents 20% of the ranking. We examine verified emissions data, renewable electricity use, worker safety, material traceability, and end-of-life recovery. Export performance contributes another 20%, using three-year customs trends, regional certifications, overseas service coverage, and delivery records. The IEA Renewables 2024 report expects global renewable capacity to expand by 5,500 GW from 2024 to 2030, with solar providing nearly 80% of the increase. Export readiness is no longer optional.

Reliability accounts for the remaining 15%. We review warranty terms, failure reporting, spare-parts access, cybersecurity controls, and independent testing. Field evidence matters most. A polished brochure does not replace years of operation. No ranking is perfectly neutral. Public ESG disclosures remain uneven, while shipment data may hide subcontracting or project delays. Some scores therefore include conservative adjustments. That is less elegant, but more honest.

China’s Top 10 Manufacturers in Solar, Wind, Storage, and Hydrogen

China’s top ten sustainable energy manufacturers span solar modules, wind turbines, battery storage, and hydrogen equipment. Their scale reflects China’s industrial depth, but “top” depends on measurable criteria. I would compare shipment volume, conversion efficiency, warranty terms, safety testing, and overseas service records.

IRENA reported that China added about 297 gigawatts of renewable capacity in 2023. That figure shows market strength, not automatic product quality.

IRENA reported that China added about 297 gigawatts of renewable capacity in 2023.

That figure shows market strength, not automatic product quality.

In solar and wind, manufacturing advantages include dense supply chains and rapid factory expansion. The Global Wind Energy Council recorded about 75.9 gigawatts of new wind capacity in China during 2023.

IEA data also placed China at roughly 80% of global battery cell production that year.

Hydrogen remains less mature. The IEA’s Global Hydrogen Review 2024 noted China’s leading position in electrolyzer manufacturing capacity.

Yet project economics can change quickly. Some published rankings overlook maintenance costs, grid compatibility, or curtailment risks.

Tips:

Request third-party test reports, degradation data, fire-safety certifications, and local service coverage. Check the full system, not only the equipment price. A low bid may hide replacement delays.

Product claims also deserve skepticism. As a practical buyer, I would test performance under heat, dust, weak grids, and winter humidity before approving large orders.

Comparing Manufacturers Through IEA, IRENA, and NEA Indicators

China’s sustainable energy manufacturers should be compared through evidence, not production claims alone. The IEA provides a broad view of energy efficiency, emissions reduction, and clean technology deployment. IRENA adds renewable capacity, cost trends, and technology maturity. NEA indicators help examine China’s installed capacity, grid integration, and energy storage development. These perspectives reveal different strengths.

A practical evaluation can begin with audited output, conversion efficiency, and warranty performance. For solar equipment, reviewers should examine degradation rates after several operating years. For wind systems, they should check availability during seasonal weather changes. Battery manufacturers require deeper testing. Cycle life, thermal management, recovery rates, and safety records matter more than a large factory floor. Small details matter.

The strongest candidates usually balance scale with measurable environmental progress. IEA-aligned data can show whether efficiency improvements reduce operational emissions. IRENA benchmarks can indicate whether renewable components remain cost-competitive. NEA statistics can test whether equipment supports China’s expanding grid and storage needs. Yet these indicators are not perfectly comparable. Reporting periods differ, and some figures rely on company disclosures. That weakness deserves attention.

A reliable review should cross-check certificates, public filings, site data, and independent testing. It should also record failed pilots, delayed deliveries, and maintenance complaints. Perfect performance is unlikely. A transparent manufacturer explains problems and corrects them. That behavior may indicate stronger long-term reliability than polished marketing language.